WARNING: The 2.x versions of Elasticsearch have passed their EOL dates. If you are running a 2.x version, we strongly advise you to upgrade.
This documentation is no longer maintained and may be removed. For the latest information, see the current Elasticsearch documentation.
The Sky’s the Limitedit
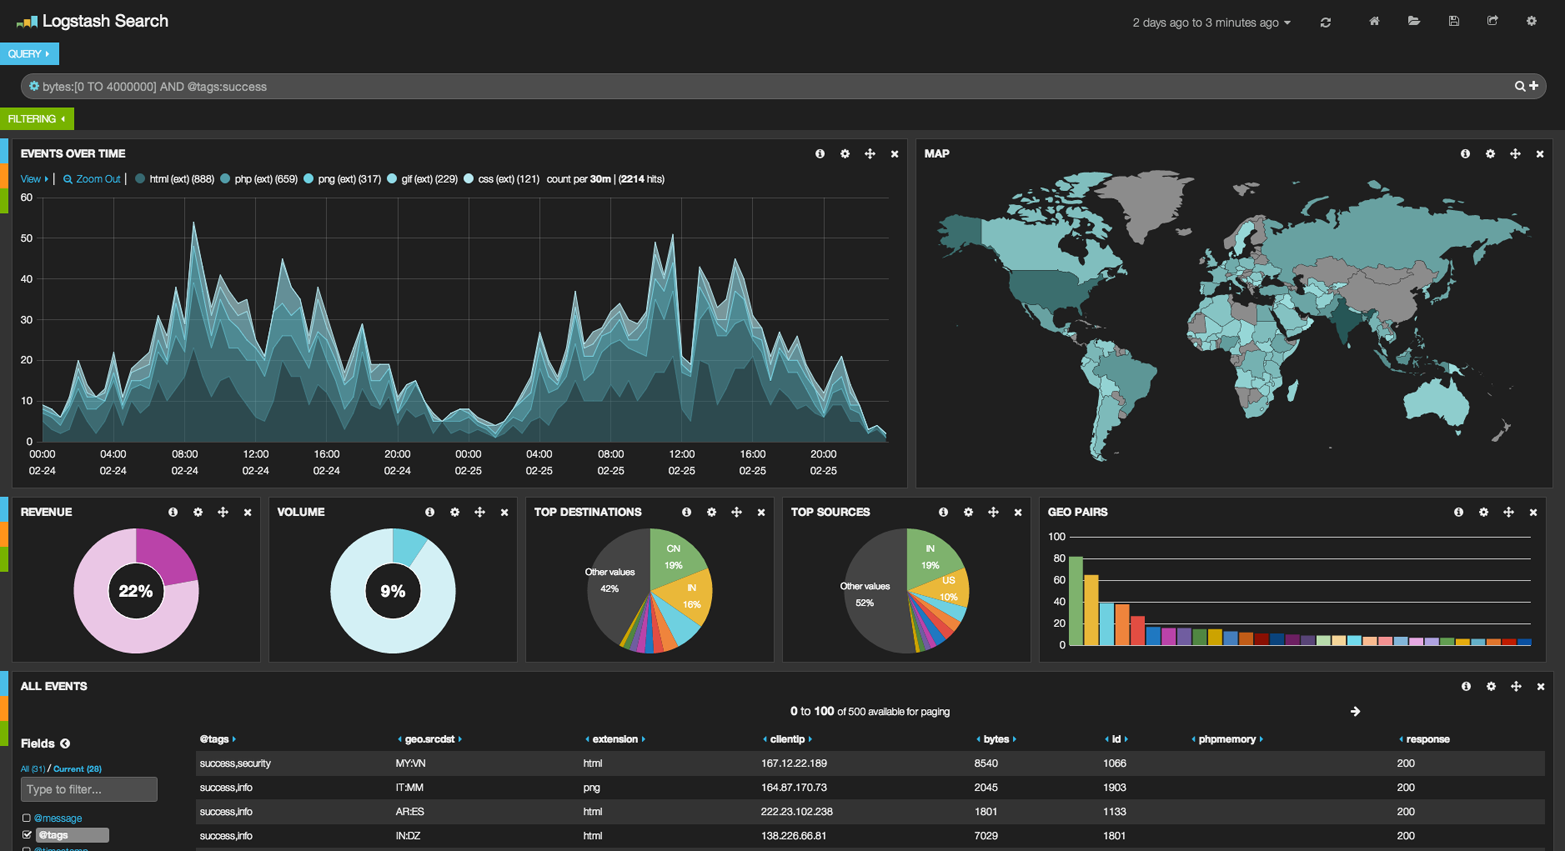
These were obviously simple examples, but the sky really is the limit when it comes to charting aggregations. For example, Figure 39, “Kibana—a real time analytics dashboard built with aggregations” shows a dashboard in Kibana built with a variety of aggregations.

Because of the real-time nature of aggregations, dashboards like this are easy to query, manipulate, and interact with. This makes them ideal for nontechnical employees and analysts who need to analyze the data but cannot build a Hadoop job.
To build powerful dashboards like Kibana, however, you’ll likely need some of the more advanced concepts such as scoping, filtering, and sorting aggregations.